In partnership with
Smarter AP automation, from startup to scale
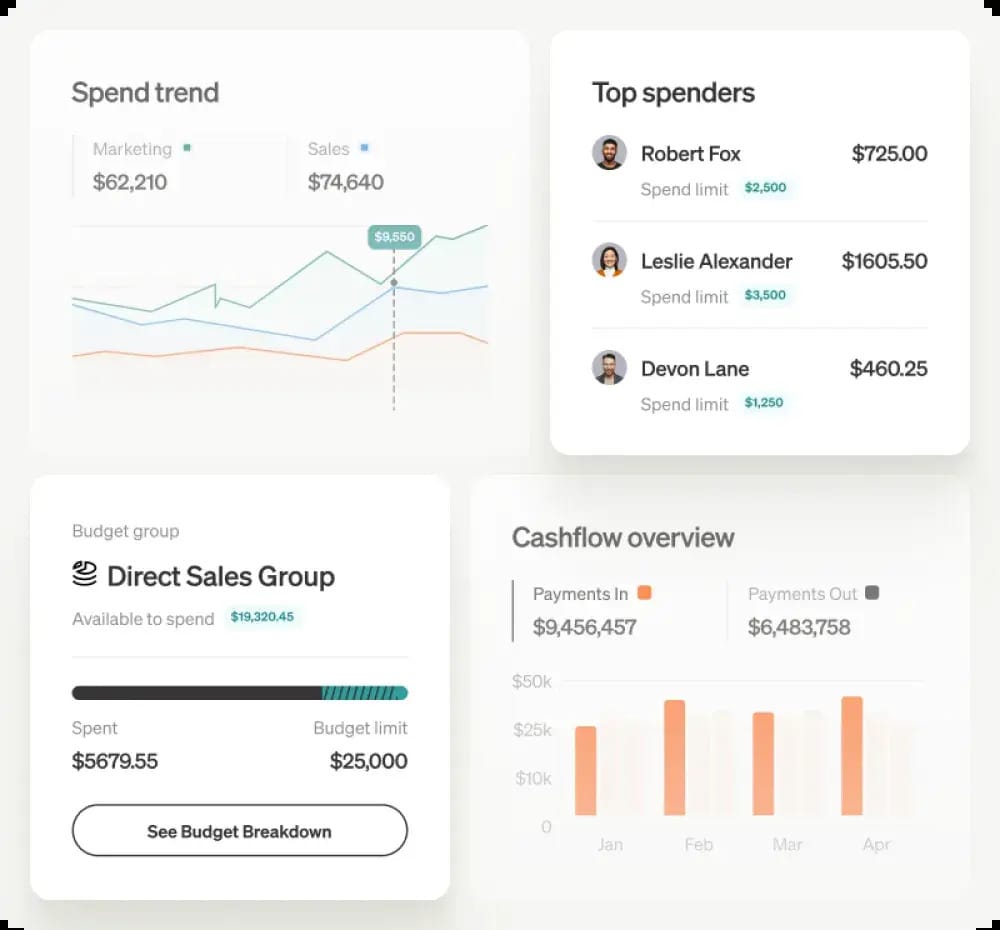
Bill.com is the accounts payable automation platform with everything you need to eliminate manual processes and scale your finance operations. Set up in minutes and enjoy streamlined workflows, real-time visibility, and enterprise-grade controls – all with reduced processing time, fewer errors, and better cash flow management.
Two powerful automation solutions, one integrated platform.
Financial automation services provided by Bill.com, LLC. Member AICPA SOC certified. Bill.com integrates with leading accounting platforms including QuickBooks, Xero, NetSuite, and Sage. All processing services provided through secure, encrypted connections. Bill.com is trusted by over 100,000 businesses to automate their financial operations and improve cash flow visibility.
WELCOME TO ISSUE NO #061
Consulting | Shop | Website | Newsletter | Speaking
📆 Today’s Rundown
Hey {{first_name}} 👋, hope you had a great week! In the last issue, we discussed why tracking Labor Cost matter, and now we are moving with the next topic from Headcount content.
Let’s talk about ⬇️
Employee Turnover Metrics
Most founders think fixing turnover means huge culture programs and a foosball table.
Truth: you need clean numbers + consistent reviews. Track these 16 metrics and you’ll spot risk months before it hits your runway.
In reality, you only need these 5 simple buckets (with the exact formulas):

TL;DR
1️⃣ Core Turnover Math (what’s actually changing)
2️⃣ Retention Health (how well you keep who you hire)
3️⃣ Hiring Dynamics (where churn really lives)
4️⃣ Cost & Productivity (translate people into dollars)
5️⃣ Engagement & Risk (leading indicators)
1️⃣ Core Turnover Math (what’s actually changing)
Overall Turnover Rate = (Total separations / Avg # of employees) × 100
Voluntary Turnover = (Employees who quit / Avg #) × 100
Involuntary Turnover = (Layoffs/terminations / Avg #) × 100
Desirable Turnover (planned upgrades) = (Desired separations / Avg #) × 100
Top-Talent Turnover = (Top-talent separations / Avg #) × 100
Benchmarks to sanity-check: Fast-growth SaaS (~50%+ YoY) often sit near ~7.5% total turnover; mid-size SaaS voluntary ≈ ~11%; involuntary ≈ ~6%. If you’re above these, dig in.

2️⃣ Retention Health (how well you keep who you hire)
Overall Retention = 100 − Overall Turnover
Top-Talent Retention = 100 − Top-Talent Turnover
New-Hire Retention (e.g., 90-day or 12-month) = (New hires who stayed / Total new hires) × 100
Average Tenure = (Total years of service / Total employees)
Use it for: promo/comp cycles, manager coaching, onboarding fixes.

3️⃣ Hiring Dynamics (where churn really lives)
Turnover by Dept/Manager/Role — same formula, filtered. Pinpoint hotspots (e.g., 3 of 5 exits from Marketing → workload or leveling issue).
Start/End Lists — who joined/left this period (names, roles, dates). Gives context beyond the %.
Empty Positions (Open Reqs) — count + days open. Open seats = lost pipeline, slower roadmaps, higher burn on contractors. Health premiums with a $15K family cap. Maybe 401(k) matching has a $5K annual limit.

4️⃣ Cost & Productivity (translate people into dollars)
Turnover Cost = Recruiting + Ads + Interview time + Onboarding + Ramp loss + (Severance/Unemployment as applicable).
Revenue per Employee = (Revenue LTM / Avg FTEs).
If RPE is flat while headcount rises, you’re buying productivity you’re not getting.

5️⃣ Engagement & Risk (leading indicators)
Employee Satisfaction Rate = (Satisfied employees / Total employees) × 100
New-Employee Satisfaction (post-onboarding) = (Satisfied new hires / Total new hires) × 100
Pro tip: run anonymous pulse surveys quarterly; segment by team and tenure.

Need clarity on your financial strategy or cash flow optimization?
I'm Aleksandar, fractional CFO at Fiscallion, where we help founders like you achieve financial clarity, streamline reporting, and build investor-ready forecasts.
Ready to level up your finances?
Quick example (Q1)
Start: 20 FTE → End: 30 FTE → Avg = (20+30)/2 = 25
Exits: 5 → Turnover = (5/25)×100 = 20% (too high for a fast-grower).
Action: map exits by manager/role, compute turnover cost, tighten onboarding & leveling, set a Top-Talent Retention target.
If you want my plug-and-play Retention Metrics Tracker (Google Sheet) + a Looker/Sheets dashboard template, reply “RETENTION” and I’ll send it.
Or snag a free 15-min retention teardown—I’ll calculate your top-talent risk and show the 2–3 fixes that move the needle fastest.
Chat soon
Earn free gifts 🎁
{{first_name}} You can get free stuff for referring friends & family to my newsletter 👇
50 referrals - Cash Flow Models Bundle 💰
10 referrals - SaaS Financial Model 📊
{{rp_personalized_text}}
Copy & Paste this link: {{rp_refer_url}}
Aleksandar Stojanovic
Chief Finance Ninja | Fiscallion
Fractional CFO & FP&A Boutique Consultancy
P.S. Whenever you’re ready, here’s how I can help:
Free Consultation: Book your strategy call.
Keynote Speaking: Schedule me for your event.
Sponsor my Newsletter: Reach 5,000+ subscribers.


