Get value stock insights free.
PayPal, Disney, and Nike recently dropped 50-80%. Are they undervalued? Can they recover? Read Value Investor Daily to find out. We read hundreds of value stock ideas daily and send you the best.

WELCOME TO ISSUE NO #07
Consulting | Shop | Website | Newsletter | Speaking | Training
📆 Today’s Rundown
Happy Saturday! This week I’ve compiled some amazing resources that will definitely impress you.
TL;DR
💰 Navigating the Numbers as a Sales Rep
👉 7 Most Important SaaS Metrics
📃 Tableau vs. Power BI
My friend Josh Aharonoff launched his new Excel Plugin - Model Wiz and finance pro’s & founders are amazed. So if you’re looking to elevate your career or business, check it out below.
I’d love to get your thoughts on this week’s poll. Share your thoughts below!
👇 Watch: Learn about the 3 Financial Statements, and how they CONNECT by Josh
Just a heads-up - this email’s sprinkled with affiliate links. If you fancy exploring them, it’s a great way to back this newsletter!

Bonus Story

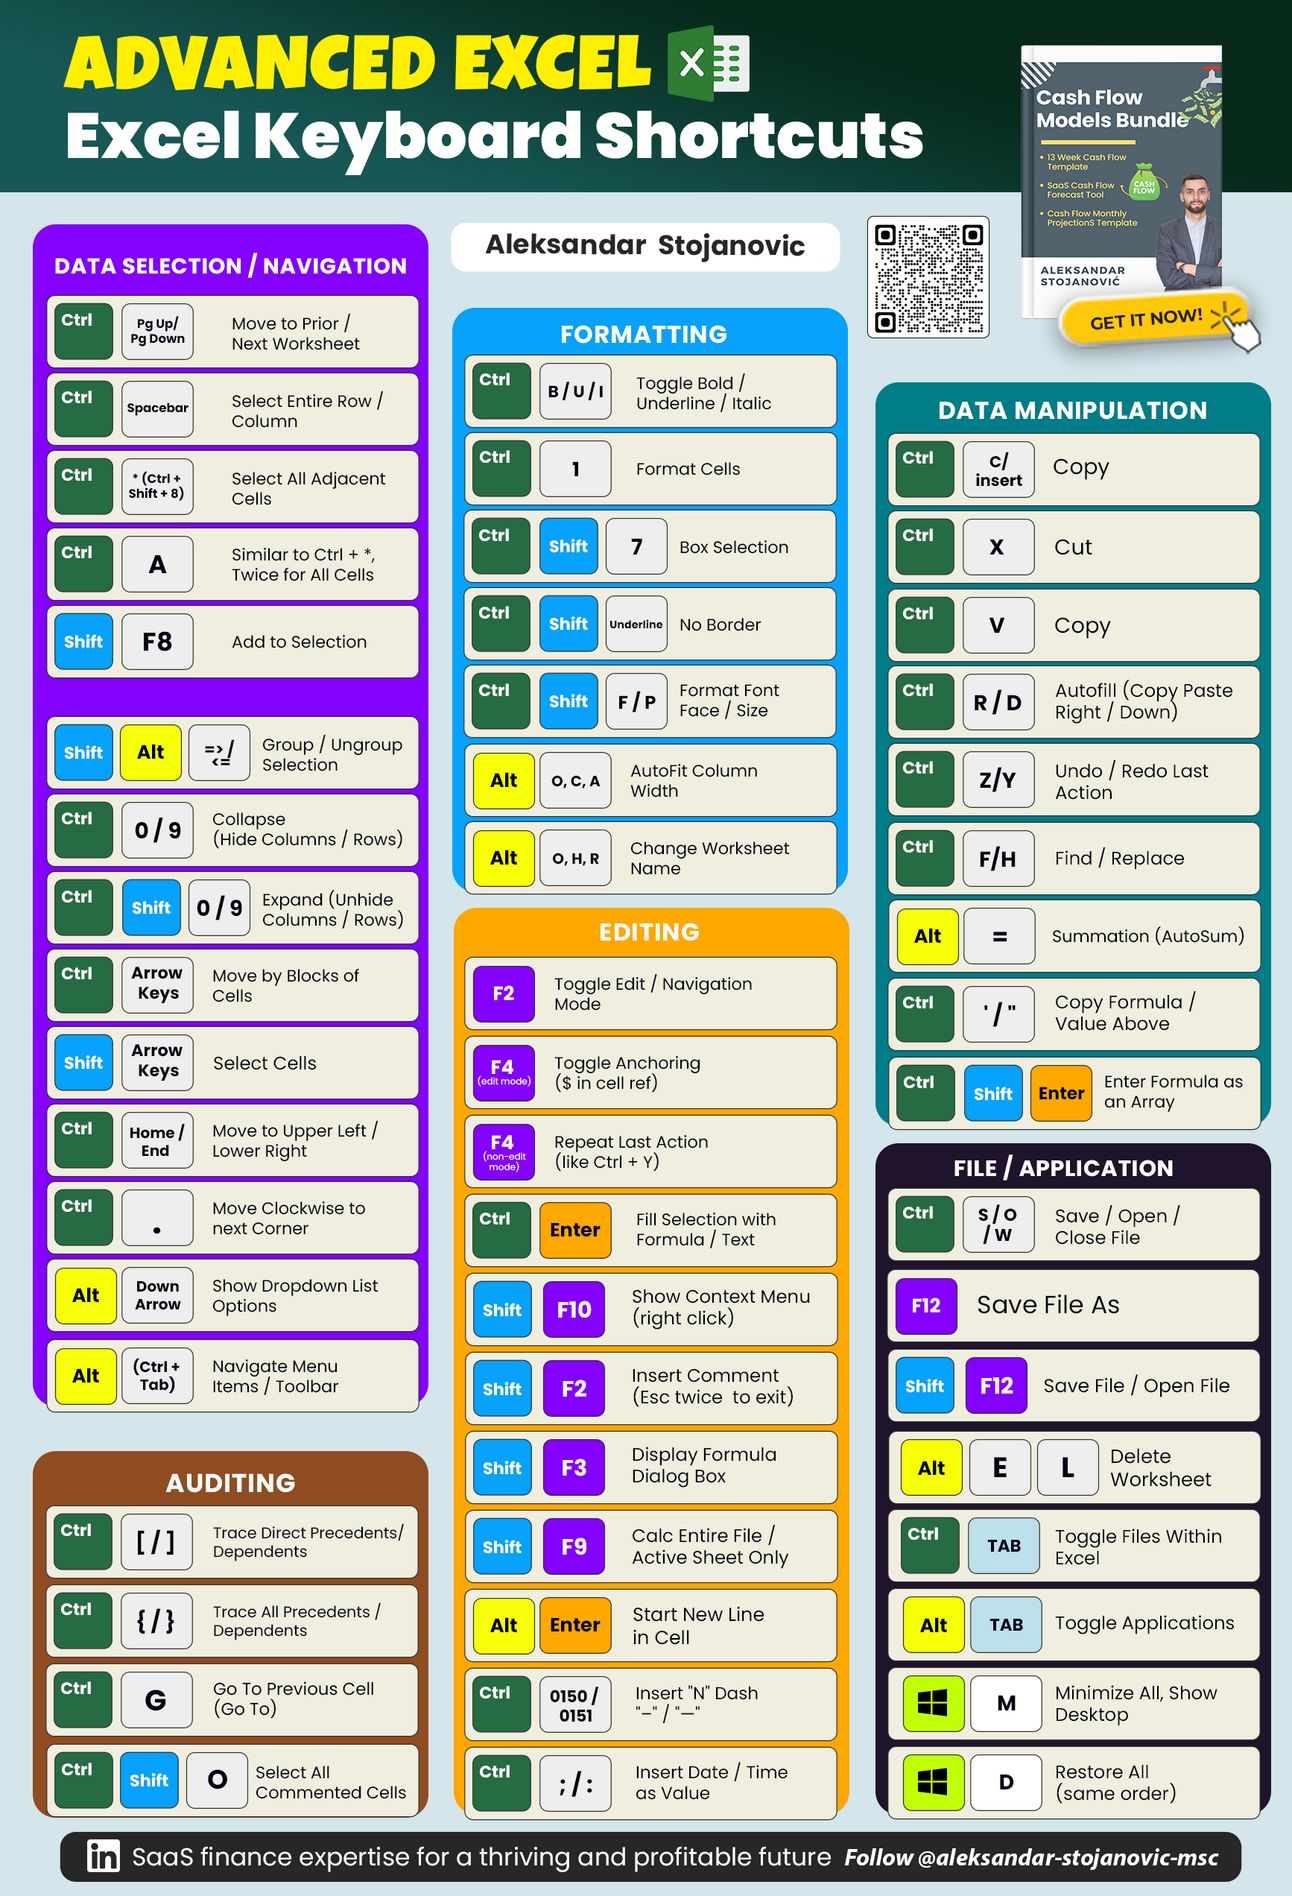
Advanced Excel Keyboard Shortcuts
I’ve spent 1000+ hours so you don’t have to.
These shortcuts will save you so many hours and give you an immense ROI.
Here's what you will receive:
▶️ Data Selection / Navigation
▶️ Data Manipulation
▶️ File / Application
▶️ Formatting
▶️ Auditing
▶️ Editing

Navigating the Numbers as a Sales Rep
(for all my friends with quotas)

1. Different Types of Revenue
Revenue isn't just a number—it's a story told through various lenses. From Bookings to Billings, ARR (Annual Recurring Revenue) to MRR (Monthly Recurring Revenue), each term unveils a different aspect of the revenue journey. Understanding these nuances paints a clearer picture of your sales landscape.

Bookings: When the deal closes & customer signs
Billings: When the accounting department actually "bills"' the customer for the "booking"
ARR (Annual Recurring Revenue): The current 12 month value of the contract
MRR (Monthly Recurring Revenue): ARR divided by 12
Revenue: Revenue is spread out to match the delivery of the product or service
Deferred Revenue: The ARR that’s not yet in Revenue
RPO (Remaining Performance Obligation): If anyone ever asks a sales person about RPO, run for the door. It’s the TCV (see below) that’s not revenue yet
TCV (Total Contract Value): All the ARR across all the years added up
Average ARR: All the ARR across all the years added up divided by number of years
2. Decoding Quotas
Ever wondered how your quota magically appears?
Behind the scenes, a complex ecosystem thrives. From sales pods to back-office support, the goal isn't just hitting targets but ensuring profitability.
Rule of thumb?
Your quota should typically be 4x to 5x your On Target Earnings (OTE), fueling the engine of success.
3. The Power of Gross Margin
Gross Margin isn't just a fancy term—it's the heartbeat of your business's financial health.
It's the difference between revenue and the cost of goods sold, dictating how much cash you have to play with.
Whether you're selling tech or building products, understanding your Gross Margin is key to unlocking opportunities for growth and innovation.
As you navigate the thrilling world of sales, remember: behind every number lies a story waiting to be told.
So, buckle up, embrace the numbers, and let's drive success together!
Got questions or insights to share?
Reach out—I’m here to fuel your journey to sales greatness.

If you’re looking to elevate your career or your business, check out Excel Plugin - Model Wiz by Josh.
These are the templates that made Josh skyrocket his career & his business, too.

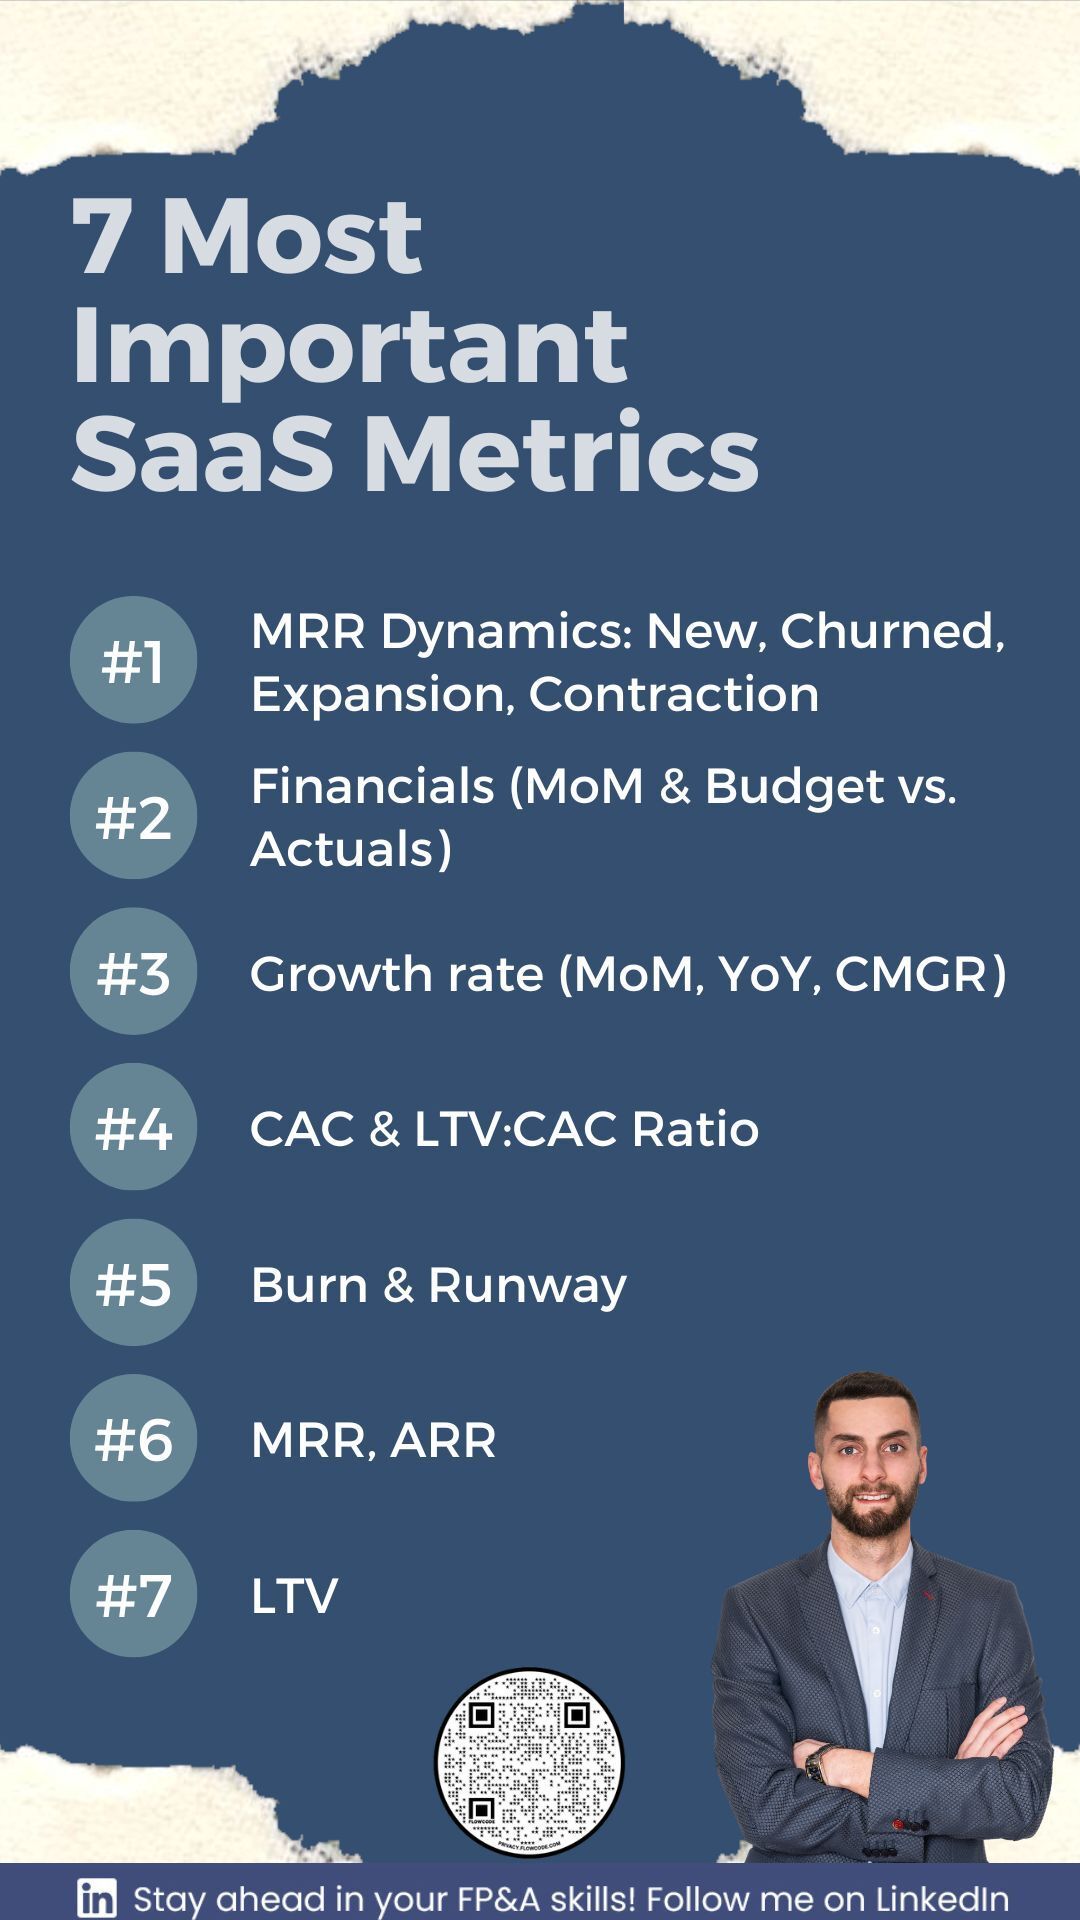
7 Most Important SaaS Metrics
Lately, I've been getting a lot of questions about how to keep your finger on the pulse of your startup's financial performance. Well, buckle up because I'm about to share the seven key metrics you should be keeping a close eye on, and how often you should be checking in.
MRR Dynamics: Think of this as your revenue heartbeat—tracking New, Churned, Expansion, and Contraction on a weekly basis gives you a real-time feel for where your business stands.
Financials: Monthly deep dives into Month-over-Month (MoM) performance and comparing Budget vs. Actuals help you stay on top of your financial game.
Growth Rate: Whether it's Month-over-Month (MoM), Year-over-Year (YoY), or Compound Monthly Growth Rate (CMGR), a monthly check-in keeps you informed on how fast you're growing.
CAC & LTV:CAC Ratio: Monthly peeks at Customer Acquisition Cost (CAC) and Lifetime Value to CAC Ratio (LTV:CAC) let you know if your customer acquisition efforts are paying off in the long run.
Burn & Runway: Monthly Burn Rate check-ins and assessing your Runway help you plan for the financial road ahead.
MRR and ARR: Keep tabs on Monthly Recurring Revenue (MRR) and Annual Recurring Revenue (ARR) every week to see how your revenue streams are flowing.
LTV: Last but not least, dive into Lifetime Value (LTV) monthly to understand the true value your customers bring to the table.
So, by staying in tune with these metrics at their recommended frequencies, you'll be armed with the insights you need to steer your SaaS ship toward success. Remember, it's all about making informed decisions backed by solid data.


Visit Fiscallion.io to learn more
Partnering with the us enables you to avoid surprises, provide financial and strategic context and ensure that the company is on the right track.
✔ Financial Model Updates and Ongoing Maintenance
✔ Board Reporting and Investor Relations
✔ Budgeting and Scenario Planning
✔ Detailed Month-End Analysis
✔ Advanced Metric Tracking
✔ Get More Clarity
✔ Save Time

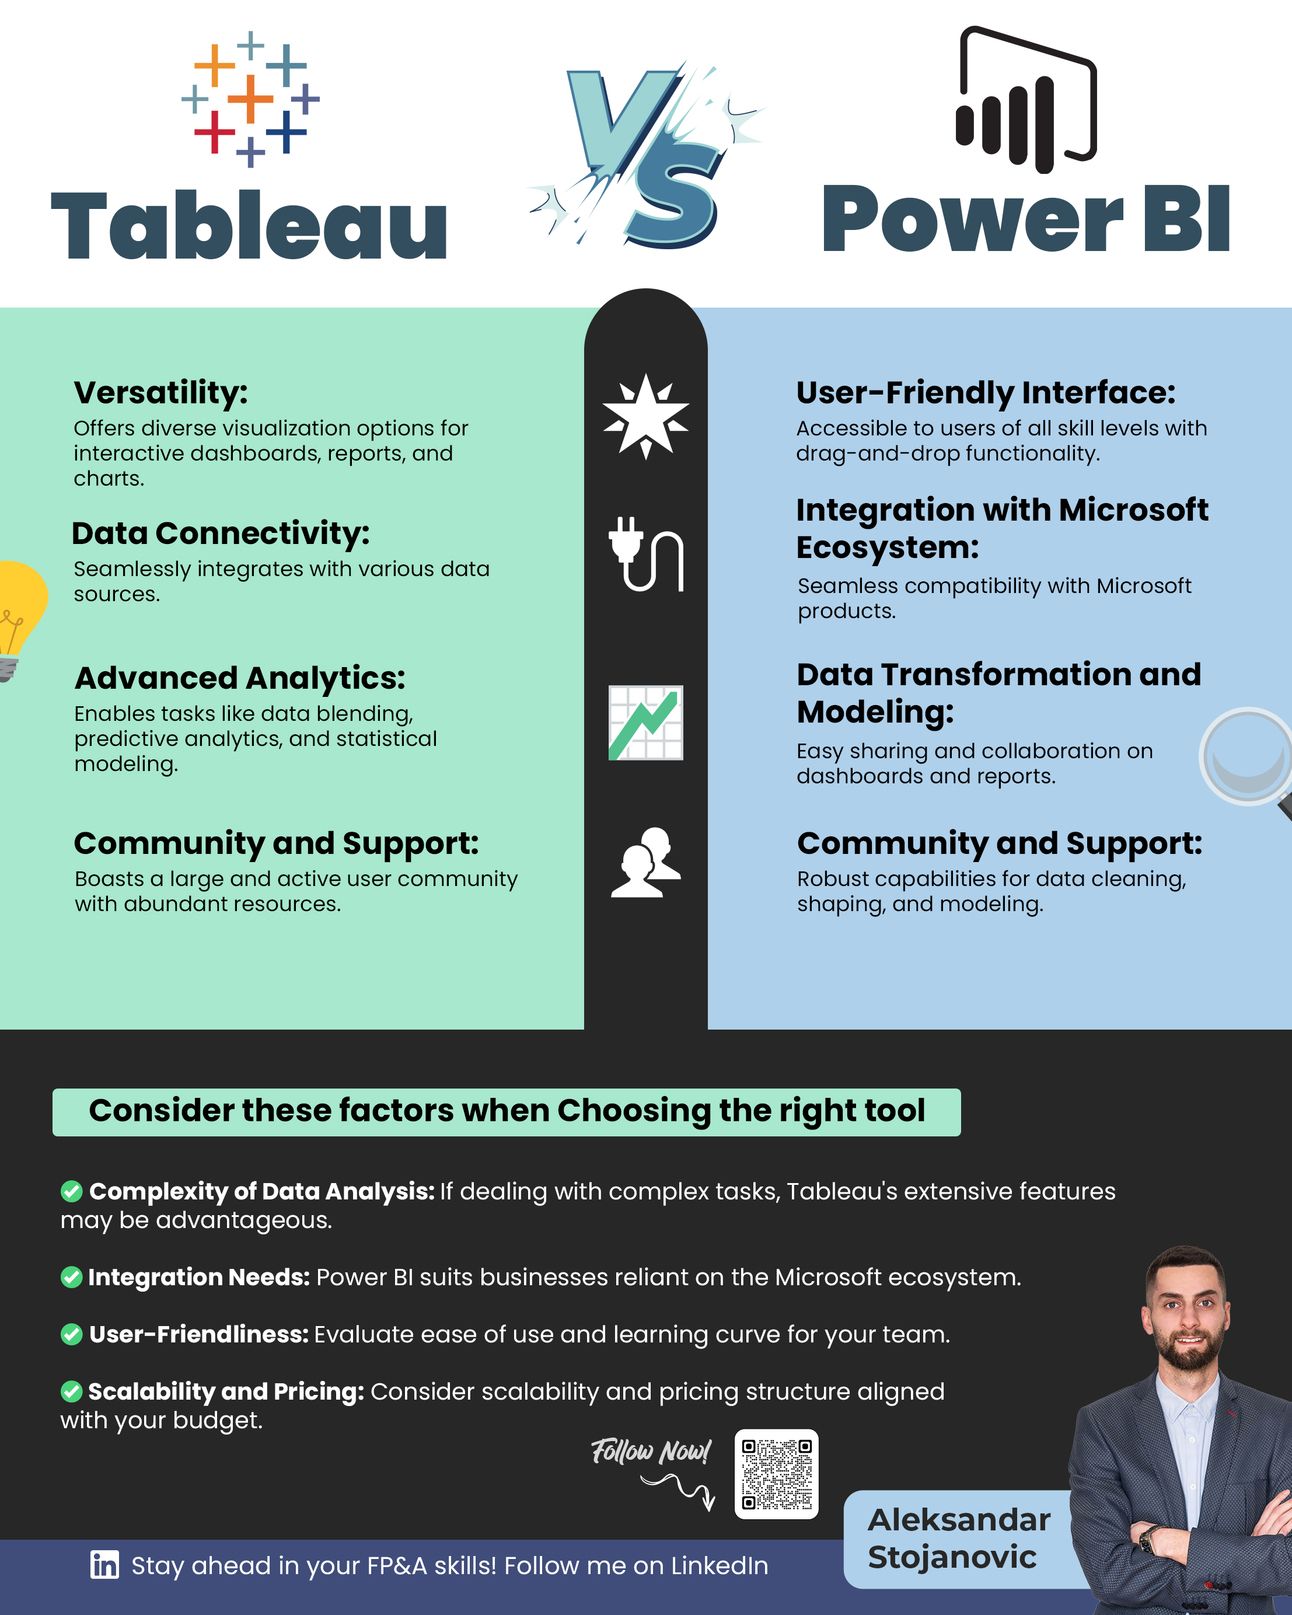
Tableau vs. Power BI
Today, we're diving deep into the realm of data visualization tools—specifically, the battle royale between Tableau and Power BI. These heavyweights offer powerful solutions, but which one reigns supreme for your SaaS business? Let's break it down.

Tableau
Tableau boasts an intuitive interface and a plethora of features that make data analysis a breeze.
Here's what sets it apart:
Versatility: From simple charts to complex visualizations, Tableau handles it all with ease.
Data Connectivity: Seamlessly connect to various data sources for comprehensive analysis.
Advanced Analytics: Dive into advanced statistical analysis and predictive modeling.
Community and Support: Tap into a vibrant community and robust support resources for guidance and inspiration.
Power BI
Developed by the tech titan Microsoft, Power BI packs a punch with its suite of business intelligence and visualization tools.
Here's what it brings to the table:
Integration with Microsoft Ecosystem: Seamlessly integrates with other Microsoft tools, streamlining your workflow.
Data Transformation and Modeling: Easily transform and model your data to uncover valuable insights.
Collaboration and Sharing: Foster collaboration among team members and share insights effortlessly.
User-Friendly Interface: With a familiar Microsoft interface, Power BI is accessible to users of all skill levels.
When deciding between Tableau and Power BI for your SaaS venture, consider these critical factors:
✅ User-Friendliness: How easy is it for your team to use and navigate the tool?
✅ Integration Needs: Does it play well with your existing tech stack?
✅ Scalability and Pricing: Can it grow with your business without breaking the bank?
✅ Complexity of Data Analysis: Does it offer the features you need for in-depth data exploration?
Now, it's time to roll up your sleeves and get hands-on.
Explore both Tableau and Power BI through trials to see which one aligns best with your data visualization needs.
Unlock the power of data visualization and arm your team with the insights they need to propel your SaaS business to new heights.
Ready to harness the power of data-driven decision-making?
Reach out to me today, and let's embark on this journey together!

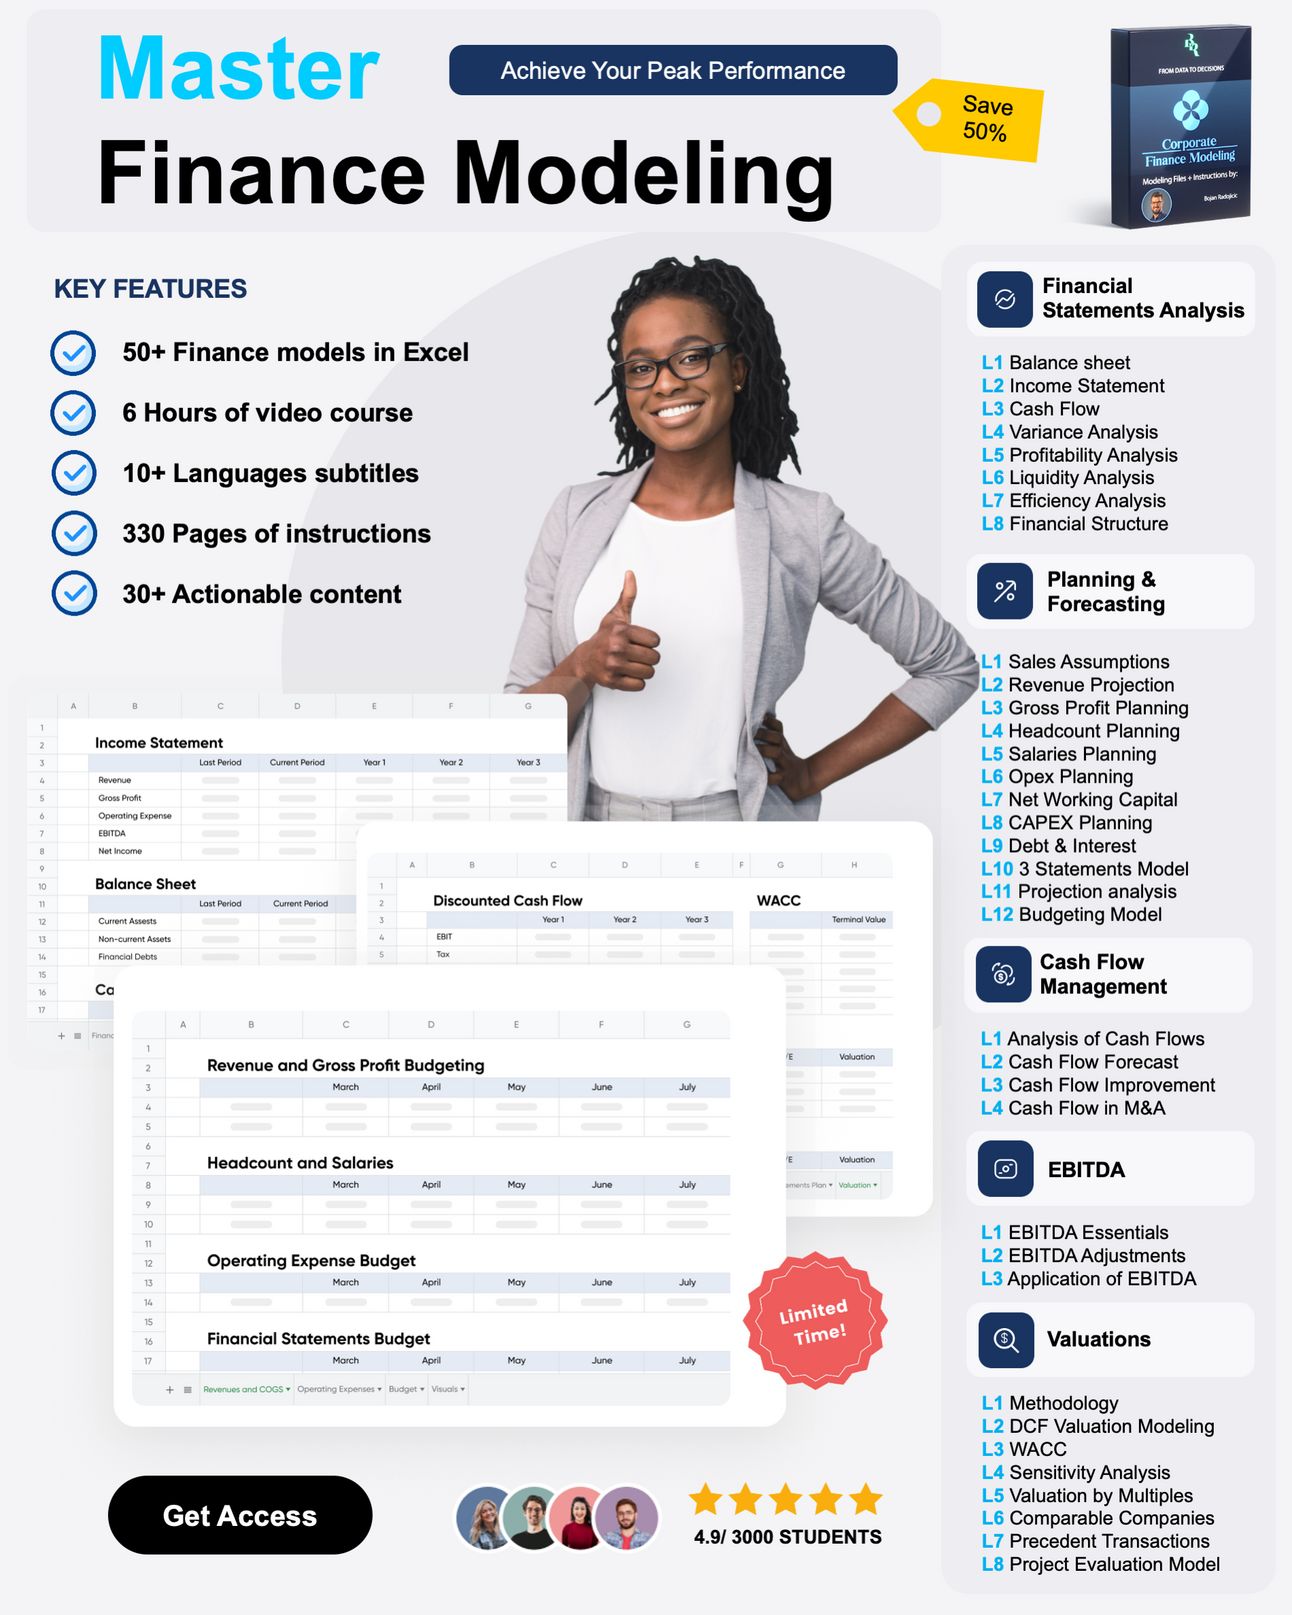
If you’re looking to elevate your career, check out The Financial Modeling Course by Bojan.
This is the method that made Bojan and other students go from misunderstood analysts to respected finance leaders.

Earn free gifts 🎁
You can get free stuff for referring friends & family to my newsletter 👇
50 referrals - Cash Flow Models Bundle 💰
10 referrals - SaaS Financial Model 📊
{{rp_personalized_text}}
Copy & Paste this link: {{rp_refer_url}}

POLL TIME
How did you enjoy this week's topics?
How would you improve the Startup Finance🚀?
Can you do me a favor? I want to know you better.
If you have specific suggestions or feedback, simply reply to this e-mail.

How can I help you?
Book a Growth Call: Looking to scale your company? Book a growth call with me and let's strategize on how to propel your company to new heights. Click here to schedule your session.
Reserve me for a Keynote Speaking: Elevate your events with my keynote speaking arrangements. Whether it's a conference, seminar, webinar or corporate event, I'm here to engage and inspire your audience with insights into strategic finance. Reach out here to discuss your event.
Dive into 1:1 Coaching: Personalized coaching can make all the difference. Let's work together to navigate the complexities of finance and set you on the path to success. Click here to start your 1:1 coaching journey.
Sponsor an Issue of the Startup Finance: Want to reach a dedicated audience of founders & finance enthusiasts? Consider sponsoring a future issue of the Startup Finance. Contact me here for sponsorship details.
Leave a Testimonial: I would appreciate if you could leave a 5-star rating for this newsletter if you enjoyed it here.
Thanks so much for reading.
Aleksandar


